Economic News
Subscribe →
HomeMonetary PolicyFiscalTradeRegulationBankingEconomic DataAbout
Vol. 02 · New Zealand
FRIDAY 22/05/2026
Iss. 2026 / 21
Economic News

Balanced. Independent. Informed.

Sections

  • Monetary Policy
  • Fiscal
  • Trade
  • Regulation
  • Banking
  • Economic Data

Subscribe

  • Free email
  • Email preferences
  • RSS feed

Company

  • About
  • Privacy policy

About

Economic News is an independent New Zealand publication covering monetary policy, markets, the public finances and the wider economy.

© 2026 Economic News Limited
.

Report Finds Less Than Quarter of Major Projects Receive Cost-Benefit — Economic News
Live
Retail Volumes Rise 0.9 Percent in March QuarterBudget 2026 Documents Available 28 May as Government Tightens SpendingHormuz Closure Turns Supply Chain Disruptions Into Multi-Year Cost Burden for New Zealand ExportersRetail Volumes Rise 0.9 Percent in March QuarterBudget 2026 Documents Available 28 May as Government Tightens SpendingHormuz Closure Turns Supply Chain Disruptions Into Multi-Year Cost Burden for New Zealand ExportersRetail Volumes Rise 0.9 Percent in March QuarterBudget 2026 Documents Available 28 May as Government Tightens SpendingHormuz Closure Turns Supply Chain Disruptions Into Multi-Year Cost Burden for New Zealand ExportersRetail Volumes Rise 0.9 Percent in March QuarterBudget 2026 Documents Available 28 May as Government Tightens SpendingHormuz Closure Turns Supply Chain Disruptions Into Multi-Year Cost Burden for New Zealand ExportersRetail Volumes Rise 0.9 Percent in March QuarterBudget 2026 Documents Available 28 May as Government Tightens SpendingHormuz Closure Turns Supply Chain Disruptions Into Multi-Year Cost Burden for New Zealand ExportersRetail Volumes Rise 0.9 Percent in March QuarterBudget 2026 Documents Available 28 May as Government Tightens SpendingHormuz Closure Turns Supply Chain Disruptions Into Multi-Year Cost Burden for New Zealand ExportersRetail Volumes Rise 0.9 Percent in March QuarterBudget 2026 Documents Available 28 May as Government Tightens SpendingHormuz Closure Turns Supply Chain Disruptions Into Multi-Year Cost Burden for New Zealand ExportersRetail Volumes Rise 0.9 Percent in March QuarterBudget 2026 Documents Available 28 May as Government Tightens SpendingHormuz Closure Turns Supply Chain Disruptions Into Multi-Year Cost Burden for New Zealand ExportersRetail Volumes Rise 0.9 Percent in March QuarterBudget 2026 Documents Available 28 May as Government Tightens SpendingHormuz Closure Turns Supply Chain Disruptions Into Multi-Year Cost Burden for New Zealand ExportersRetail Volumes Rise 0.9 Percent in March QuarterBudget 2026 Documents Available 28 May as Government Tightens SpendingHormuz Closure Turns Supply Chain Disruptions Into Multi-Year Cost Burden for New Zealand ExportersRetail Volumes Rise 0.9 Percent in March QuarterBudget 2026 Documents Available 28 May as Government Tightens SpendingHormuz Closure Turns Supply Chain Disruptions Into Multi-Year Cost Burden for New Zealand ExportersRetail Volumes Rise 0.9 Percent in March QuarterBudget 2026 Documents Available 28 May as Government Tightens SpendingHormuz Closure Turns Supply Chain Disruptions Into Multi-Year Cost Burden for New Zealand ExportersRetail Volumes Rise 0.9 Percent in March QuarterBudget 2026 Documents Available 28 May as Government Tightens SpendingHormuz Closure Turns Supply Chain Disruptions Into Multi-Year Cost Burden for New Zealand ExportersRetail Volumes Rise 0.9 Percent in March QuarterBudget 2026 Documents Available 28 May as Government Tightens SpendingHormuz Closure Turns Supply Chain Disruptions Into Multi-Year Cost Burden for New Zealand ExportersRetail Volumes Rise 0.9 Percent in March QuarterBudget 2026 Documents Available 28 May as Government Tightens SpendingHormuz Closure Turns Supply Chain Disruptions Into Multi-Year Cost Burden for New Zealand ExportersRetail Volumes Rise 0.9 Percent in March QuarterBudget 2026 Documents Available 28 May as Government Tightens SpendingHormuz Closure Turns Supply Chain Disruptions Into Multi-Year Cost Burden for New Zealand ExportersRetail Volumes Rise 0.9 Percent in March QuarterBudget 2026 Documents Available 28 May as Government Tightens SpendingHormuz Closure Turns Supply Chain Disruptions Into Multi-Year Cost Burden for New Zealand ExportersRetail Volumes Rise 0.9 Percent in March QuarterBudget 2026 Documents Available 28 May as Government Tightens SpendingHormuz Closure Turns Supply Chain Disruptions Into Multi-Year Cost Burden for New Zealand ExportersRetail Volumes Rise 0.9 Percent in March QuarterBudget 2026 Documents Available 28 May as Government Tightens SpendingHormuz Closure Turns Supply Chain Disruptions Into Multi-Year Cost Burden for New Zealand ExportersRetail Volumes Rise 0.9 Percent in March QuarterBudget 2026 Documents Available 28 May as Government Tightens SpendingHormuz Closure Turns Supply Chain Disruptions Into Multi-Year Cost Burden for New Zealand ExportersRetail Volumes Rise 0.9 Percent in March QuarterBudget 2026 Documents Available 28 May as Government Tightens SpendingHormuz Closure Turns Supply Chain Disruptions Into Multi-Year Cost Burden for New Zealand ExportersRetail Volumes Rise 0.9 Percent in March QuarterBudget 2026 Documents Available 28 May as Government Tightens SpendingHormuz Closure Turns Supply Chain Disruptions Into Multi-Year Cost Burden for New Zealand ExportersRetail Volumes Rise 0.9 Percent in March QuarterBudget 2026 Documents Available 28 May as Government Tightens SpendingHormuz Closure Turns Supply Chain Disruptions Into Multi-Year Cost Burden for New Zealand ExportersRetail Volumes Rise 0.9 Percent in March QuarterBudget 2026 Documents Available 28 May as Government Tightens SpendingHormuz Closure Turns Supply Chain Disruptions Into Multi-Year Cost Burden for New Zealand Exporters
FISCAL GOVERNANCE · INFRASTRUCTURE SPENDING

Report Finds Less Than Quarter of Major Projects Receive Cost-Benefit Analysis

New Zealand spends about $20 billion a year on public infrastructure yet less than a quarter of major projects receive a formal cost-benefit analysis of the preferred option.

Fiscal Desk21/05/2026 · 05:30 NZT7 min read
FiscalBreaking
FD
Fiscal Desk
Fiscal Policy Correspondent · 21/05/2026 · 05:30 NZT · 7 min read
Wellington construction cranes rise beside the Beehive in the CBD under clear sky

At a glance

A Helen Clark Foundation report finds NZ's $275B infrastructure pipeline is overwhelmingly selected without formal value-for-money analysis, with post-completion reviews nearly absent.

Key stats

Annual public infrastructure spend
$20B
approx.
National Infrastructure Pipeline
$275B
Sept 2025
Pipeline initiatives tracked
~12,000
Pipeline value lacking full funding
$193B
70%+
Agencies using CBA consistently
2 of 6
central govt
Major projects receiving formal CBA
<25%
of preferred option
"Why aren't we checking to see whether the project delivered the value we said it would deliver?"Kali Mercier, Helen Clark Foundation

Sources cited

  • Measuring What Matters: Getting The Best Value from Infrastructure Investment — Helen Clark Foundation / WSP
  • National Infrastructure Plan Online — Te Waihanga
  • National Infrastructure Pipeline — Te Waihanga
  • CBAx Tool — New Zealand Treasury
  • Guide to Social Cost Benefit Analysis — New Zealand Treasury
  • Monetised Benefits and Costs Manual and Research Report 700 — Waka Kotahi

Free

New Zealand's economy, straight to your inbox.

By subscribing you accept our privacy policy.

More from fiscal

Shoppers browsing a well-stocked New Zealand supermarket aisle, illustrating the retail trade activity recorded in the March 2026 quarter
Economic Data · 22/05/2026 · 13:16 NZT

Retail Volumes Rise 0.9 Percent in March Quarter

New Zealand retail sales volumes increased 0.9 percent in the March 2026 quarter on a seasonally adjusted basis. The gain matched the December 2025 quarter and exceeded market expectations of 0.5 percent.

Data Desk·22/05/2026 · 13:16 NZT·6 min
A Wellington government office interior with stacked Budget documents on a conference table and harbour views, representing Budget 2026 preparations
Fiscal · 22/05/2026 · 09:32 NZT

Budget 2026 Documents Available 28 May as Government Tightens Spending

Budget 2026 documents go online from 2pm on Thursday 28 May, with hard-copy packs on sale for $55 through two retailers.

Fiscal Desk·22/05/2026 · 09:32 NZT·8 min
Wellington's Lambton Quay looking toward the Beehive on an overcast morning, a For Lease sign visible in a ground-floor office window
Economic Data · 21/05/2026 · 14:53 NZT

BDO Index Shows Multi-Speed Recovery as Fuel Shocks Hit Domestic Sectors

Business leaders report modest gains in financial positivity while overall sentiment stays near record lows, underscoring a diverging economy where export-oriented sectors gain ground and domestic-facing industries struggle under fuel-price pressures and pre-election uncertainty.

Analysis Desk·21/05/2026 · 14:53 NZT·22 min

All fiscal →

New Zealand spends about $20 billion a year on public infrastructure yet less than a quarter of major projects receive a formal cost-benefit analysis of the preferred option.

A Helen Clark Foundation report published on 20 May 2026 found only two of six central government agencies apply cost-benefit analysis consistently. Waka Kotahi and Kāinga Ora are the exceptions. The other four agencies and most local councils treat the tool as optional.

The National Infrastructure Pipeline tracks nearly 12,000 initiatives worth $275 billion as of September 2025. More than two-thirds of that value, or $193 billion, lacks full funding.

Treasury released an updated CBAx tool for Budget 2026. The original version dates to 2015. Agencies also have the 2015 Guide to Social Cost Benefit Analysis and Waka Kotahi's Monetised Benefits and Costs Manual. The report notes that urgency provisions and shifting priorities often bypass these frameworks.

AI illustration of the scale of New Zealand's infrastructure pipeline against the small fraction of projects receiving formal cost-benefit analysis, as documented in the Helen Clark Foundation's May 2026 report.

A Consistency Gap Across Government

Kali Mercier, deputy director of the Helen Clark Foundation and author of the report, said: "The main finding is that we should be using cost-benefit analysis a lot more, it's really important that we do the economic analysis of all the projects that we're planning to put vast sums of money into to make sure that we're getting value for money."

She added that post-implementation evaluation is almost entirely absent.

"The other thing we're not doing very well is post-implementation evaluation of projects. We should be looking back at these projects, every single one, we're spending a billion dollars or so. Why aren't we checking to see whether the project delivered the value we said it would deliver?" — Kali Mercier, Helen Clark Foundation

Minister Points to Investment Management System Reforms

Infrastructure Minister Chris Bishop welcomed the report. He noted recent updates to the Investment Management System and the transfer of project assurance from Treasury to the independent Infrastructure Commission.

"We've already announced changes to improve how the Government selects infrastructure projects, including updates to the Investment Management System to ensure projects meet New Zealanders' needs, deliver value for money, and can be successfully delivered. This includes transferring infrastructure project assurance from The Treasury to the independent NZ Infrastructure Commission." — Chris Bishop, Infrastructure Minister

High-profile overruns continue to highlight the problem. Former City Rail Link boss Sean Sweeney estimated the project could have cost half as much with firmer early design decisions.

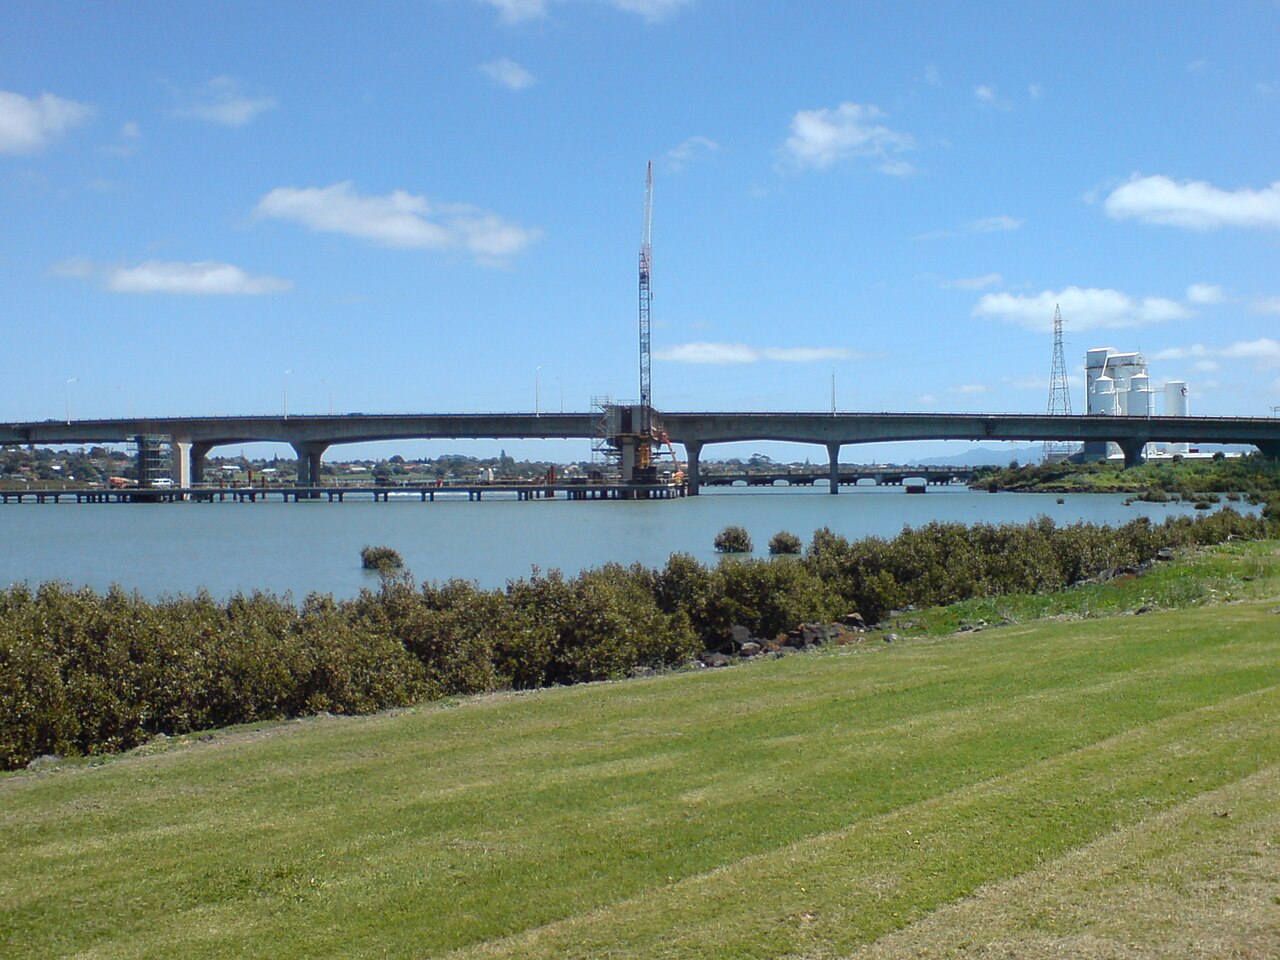
Mangere Bridge under construction — a New Zealand infrastructure project of the kind the Helen Clark Foundation report says should be subject to mandatory cost-benefit analysis and post-completion review.

An International Benchmark

Australia's Infrastructure Australia mandates published business cases and post-completion reviews for large projects. New Zealand's tools exist on paper but lack mandatory application.

The $275 billion pipeline and $20 billion annual spend represent a major claim on future taxpayers. Without systematic analysis, poorly chosen projects risk locking in higher debt and lower productivity gains.

Mercier called for the Infrastructure Commission to require published benefit-cost ratios and business cases for all major projects. She also urged mandatory post-completion reviews.

The next National Infrastructure Strategy and Budget round offer a clear window to embed these requirements. Fiscal discipline demands that every infrastructure dollar demonstrably improves productivity or resilience rather than adding to Crown liabilities.

National Infrastructure Pipeline: Funded vs Unfunded Value
More than two-thirds of the pipeline by value lacks full funding as of September 2025.
Source: Te Waihanga National Infrastructure Pipeline, September 2025