New Zealand Must Shift Infrastructure Spending Toward Maintenance Over New Builds
New Zealand faces a $1 trillion infrastructure lifecycle obligation over the next 30 years that stems directly from chronic government underinvestment in maintenance and renewals. Shifting 60 to 80 percent of spending toward existing assets is now essential to prevent compounding debt and lost productivity.
The Government will direct $5 million from the International Visitor Levy into one-off marketing and business events programmes for the 2026/27 year to accelerate tourism's return toward pre-pandemic levels.
The Government will remove nine health and life insurers from New Zealand's mandatory climate-related disclosures regime, reducing the total number of required reporting entities to 67.
Former United Future leader Peter Dunne has called for an independent body to scrutinise opposition parties' spending commitments, arguing that New Zealand's existing fiscal transparency rules leave a critical gap ahead of elections.
New Zealand confronts a $1 trillion infrastructure lifecycle obligation over the next 30 years in today's prices, driven by decades of under-spending on maintenance and renewals relative to new capital investment. Shifting 60 to 80 percent of spending toward existing assets is now essential to prevent compounding debt and lost productivity.
That figure more than doubles the country's 2025 nominal GDP of $445 billion (Stats NZ). The scale arises from a sustained failure to maintain what already exists — a pattern now documented in granular detail by the NZ Infrastructure Commission | Te Waihanga and Infrastructure New Zealand.
Te Waihanga data show that between 2013 and 2022 depreciation equalled 58 percent of new capital investment. Nearly six of every ten infrastructure dollars simply replaced worn-out assets. The National Infrastructure Plan now demands that 60 percent of future spending go to maintenance and renewals. Beca specialist Priyani de Silva-Currie argues some portfolios will require 80 percent.
This pivot carries direct policy implications. Every dollar locked into new motorways or stop-banks becomes unavailable for higher-value priorities. Fiscal headroom remains tight with net core Crown debt near 42 percent of GDP. Any sustained increase in renewal spending demands explicit trade-offs against new social projects or tax relief.
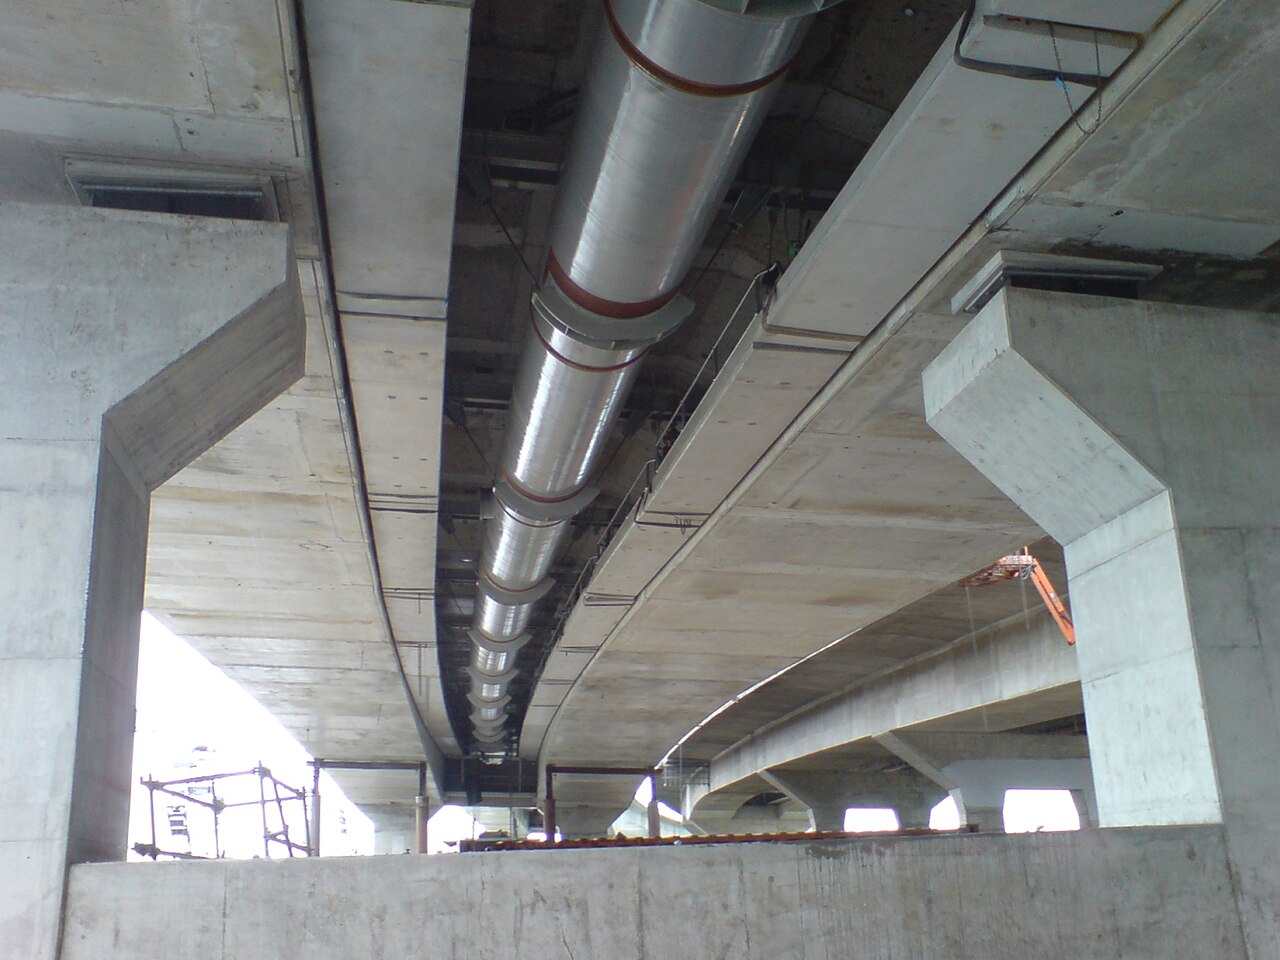
Māngere Bridge alongside a new freshwater main, Auckland. New Zealand's councils face a $50 billion water-network renewal bill over the next decade — equivalent in inflation-adjusted terms to all water and wastewater spending from 1885 to 2012. (Ingolfson · Public domain · Wikimedia Commons)
Drivers of the Gap
Chronic under-spending on renewals lies at the root. More than half of public infrastructure assets sit at or near end of life, according to Infrastructure New Zealand's March 2026 report Looking After What We Have, Better. Renewal spending by local authorities has averaged only 76 to 78 percent of depreciation since 2012/13. Central government owns 44 percent of the $393 billion critical asset base while local government holds 25 percent.
Natural hazards compound the problem. Central government spent at least $33 billion responding to events between 2010 and 2025, according to the Te Waihanga National Infrastructure Plan. Annual losses from hazards equal 0.6 percent of GDP, second worst in the OECD. In Nelson and Tasman, three one-in-100-year floods struck in five years. Flood risk in Māpua is projected to more than double over the next 50 years.
Consenting processes add further drag. According to Te Waihanga's analysis of consenting costs, they impose an estimated $1.3 billion annually, or 5.5 percent of project totals on average. The National Infrastructure Pipeline, as of September 2025, contains nearly 12,000 initiatives worth $275 billion, with $193 billion still unfunded (Te Waihanga National Infrastructure Plan, March 2026).
Trade-Offs Within Tight Fiscal Baselines
Visible new builds deliver short-term political credit. Systematic renewals deliver long-term fiscal discipline. The choice matters because New Zealand already spends 5.8 percent of GDP on infrastructure annually, among the highest in the OECD, yet the country ranks toward the bottom for efficiency and value for money (Te Waihanga National Infrastructure Plan).
“If we don’t make asset management a mandatory part of the overall planning, funding and delivery system now, our infrastructure deficit will only continue to be compounded.” — Priyani de Silva-Currie, Technical Fellow – Strategic Asset Management, Beca
Legislative mandates for long-term asset management plans would force agencies to confront these trade-offs explicitly. A $100 million capability fund could address the shortage of roughly 1,500 qualified asset managers (Infrastructure New Zealand, Looking After What We Have, Better). Fewer than a dozen organisations hold ISO 55001 certification. Without these steps, net Crown debt could reach 200 percent of GDP by 2065, or $237,900 per person, according to Te Waihanga modelling.
User charges and rates will inevitably rise if renewal backlogs persist. The alternative is service degradation across water, transport, energy and health assets that businesses and households rely upon daily.
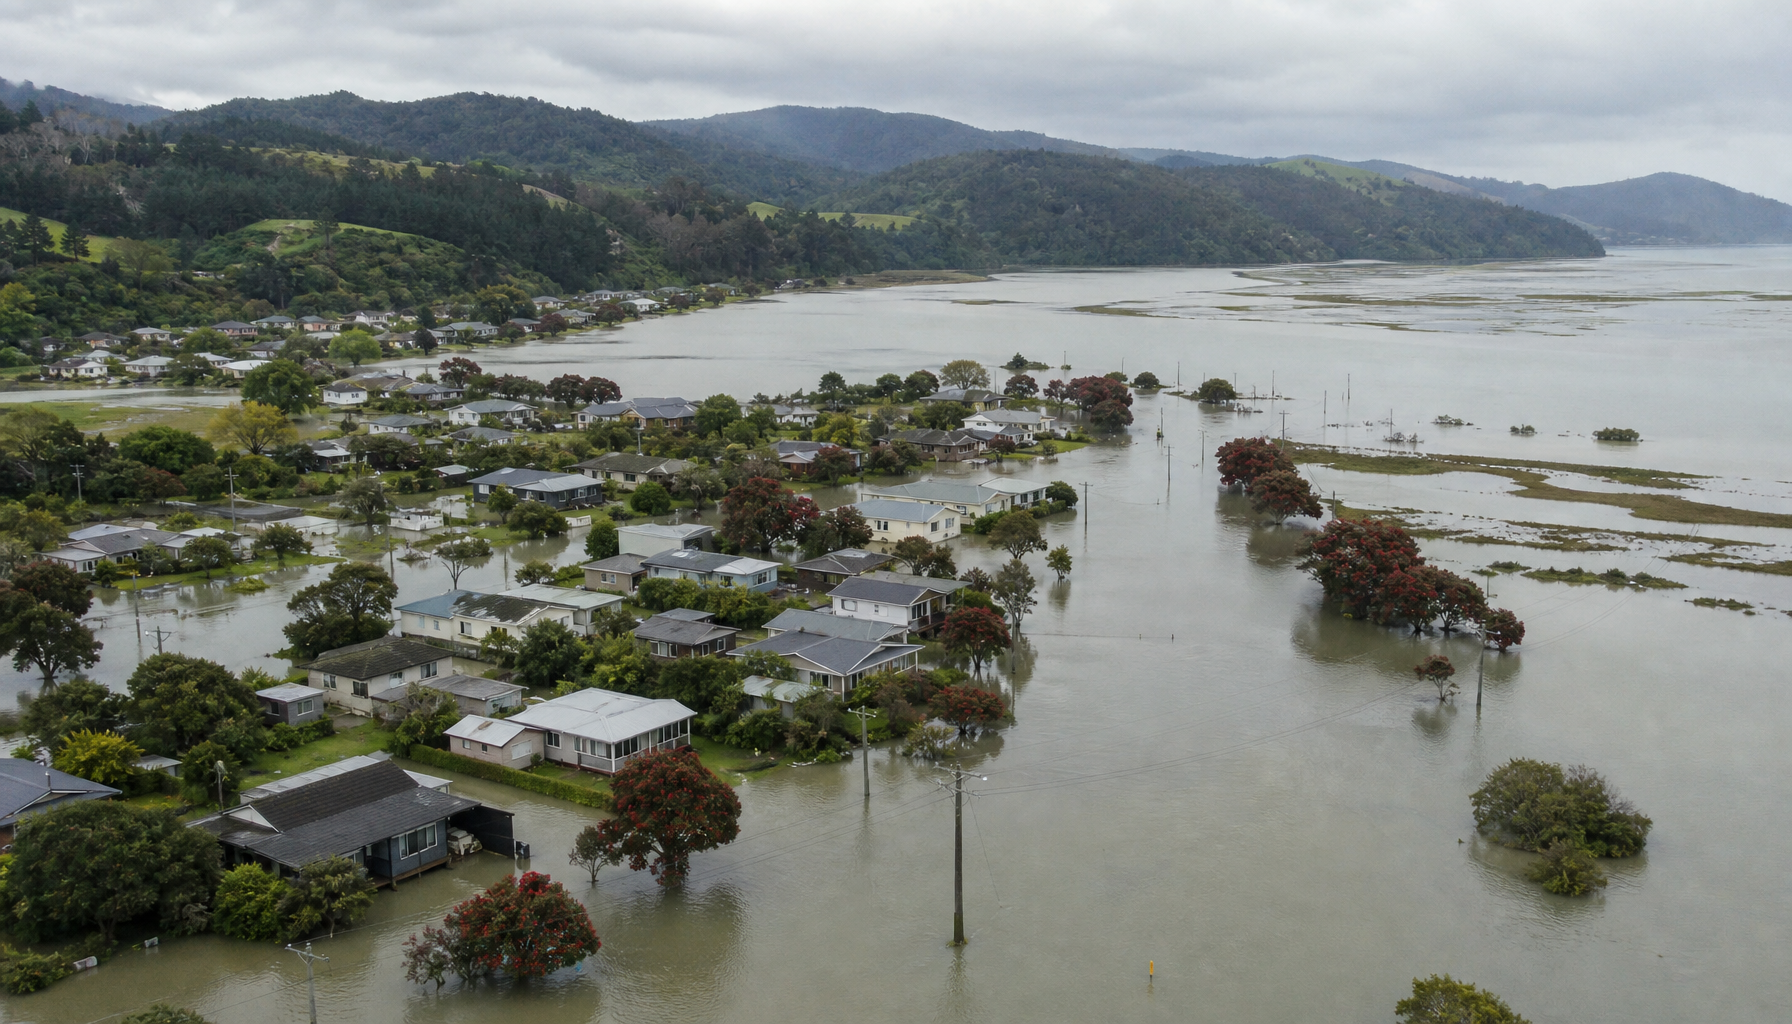
AI illustration of flood inundation risk in a Nelson-Tasman coastal settlement. The Infrastructure Commission projects flood risk in Māpua will more than double over the next 50 years — one of the starkest illustrations of compounding climate-hazard costs facing New Zealand's infrastructure managers.
Infrastructure Investment as Share of GDP
New Zealand has spent at the high end of OECD peers yet ranks low on efficiency.
Source: Te Waihanga National Infrastructure Plan (March 2026)
Second-Order Effects for Households and Business
Productivity will suffer if critical assets degrade faster than they are renewed. Water networks, roads and energy infrastructure underpin daily commerce. Reactive repairs absorb capital that could otherwise support growth.
Rates pressure on councils will intensify. The $50 billion council water-network renewal spend planned over the next decade already equals total inflation-adjusted water and wastewater outlays from 1885 to 2012 (1News, citing Te Waihanga data). Central transfers may rise to cover gaps, further straining national fiscal space.
Credit markets will notice credible stewardship. Demonstrating disciplined whole-of-life planning could support stronger sovereign ratings and lower long-term borrowing costs. Failure risks compounding climate-related losses in vulnerable regions such as Nelson-Tasman.
Historical Context
New Zealand once led global practice in the 1990s and 2000s, exporting asset-management frameworks to Europe. The country achieved what experts describe as world-first status. That leadership eroded as political incentives favoured visible new projects over unglamorous renewals.
“New Zealand was an asset management leader of some repute, and we exported this knowledge to Europe, we were world first, and then slowly, slowly, slowly, we’ve started dropping away.” — Priyani de Silva-Currie, Beca
Today New Zealand ranks fourth lowest out of 33 OECD countries for infrastructure governance and last for asset-management accountability, according to Infrastructure New Zealand's March 2026 report drawing on the OECD's 2023 Survey on the Governance of Infrastructure. The pattern matches other small, dispersed economies where new capital crowds out maintenance. Australia and Canada advanced while New Zealand slipped.
The Counter-Argument
Some argue that New Zealand already invests heavily and should focus on efficiency rather than mandates. Historical spending at 5.8 percent of GDP sits at the upper end of OECD peers. Blanket increases risk waste without better prioritisation.
This view holds weight where poor project selection has occurred. Yet evidence from Te Waihanga shows the efficiency gap persists precisely because whole-of-life asset management remains optional rather than mandatory. Without legislative requirements and dedicated funding streams, the deficit compounds regardless of headline spending levels.
Open Questions
The exact split between new-build and renewal spending under the 6 percent GDP target remains unclear. Budget 2026 capital uplifts of $5.7 billion will test whether new money flows disproportionately to visible projects or renewals (Deloitte New Zealand, From Reaction to Resilience).
The timeline for building 1,500 qualified asset managers and increasing ISO 55001 certifications will reveal whether mandates translate into capability gains. Private-sector and pension-fund response to ring-fenced renewal funds will also shape outcomes.
Path Forward
Te Waihanga recommends legislative mandates for capital-intensive agencies to publish long-term investment and asset-management plans. An independent assurance function and performance reporting would embed accountability. These reforms must accompany the $100 million capability fund if New Zealand is to arrest deterioration and restore fiscal headroom. The choice is between continued reactive spending or disciplined stewardship that protects future generations from higher debt and lower services.