Civil construction labour productivity fell 6% in four years, Te Waihanga data show
Labour productivity in New Zealand civil construction fell 6% between 2020 and 2024, Newsroom reported from Te Waihanga data, erasing most of two decades of prior gains as a multi-hundred-billion infrastructure pipeline looms.
New Zealand rural confidence stayed positive for a ninth straight quarter in August 2026, with horticulturalists overtaking sheep and beef as the most optimistic sector while investment plans stayed soft.
ASB’s Q2 2026 Regional Economic Scoreboard left Wellington joint last with Gisborne while Canterbury led on dairy cash, jobs and retail. The capital’s multi-quarter underperformance is structural: public-service consolidation, a deep housing correction and stalled population growth colliding with a national OCR still set for nationwide inflation.
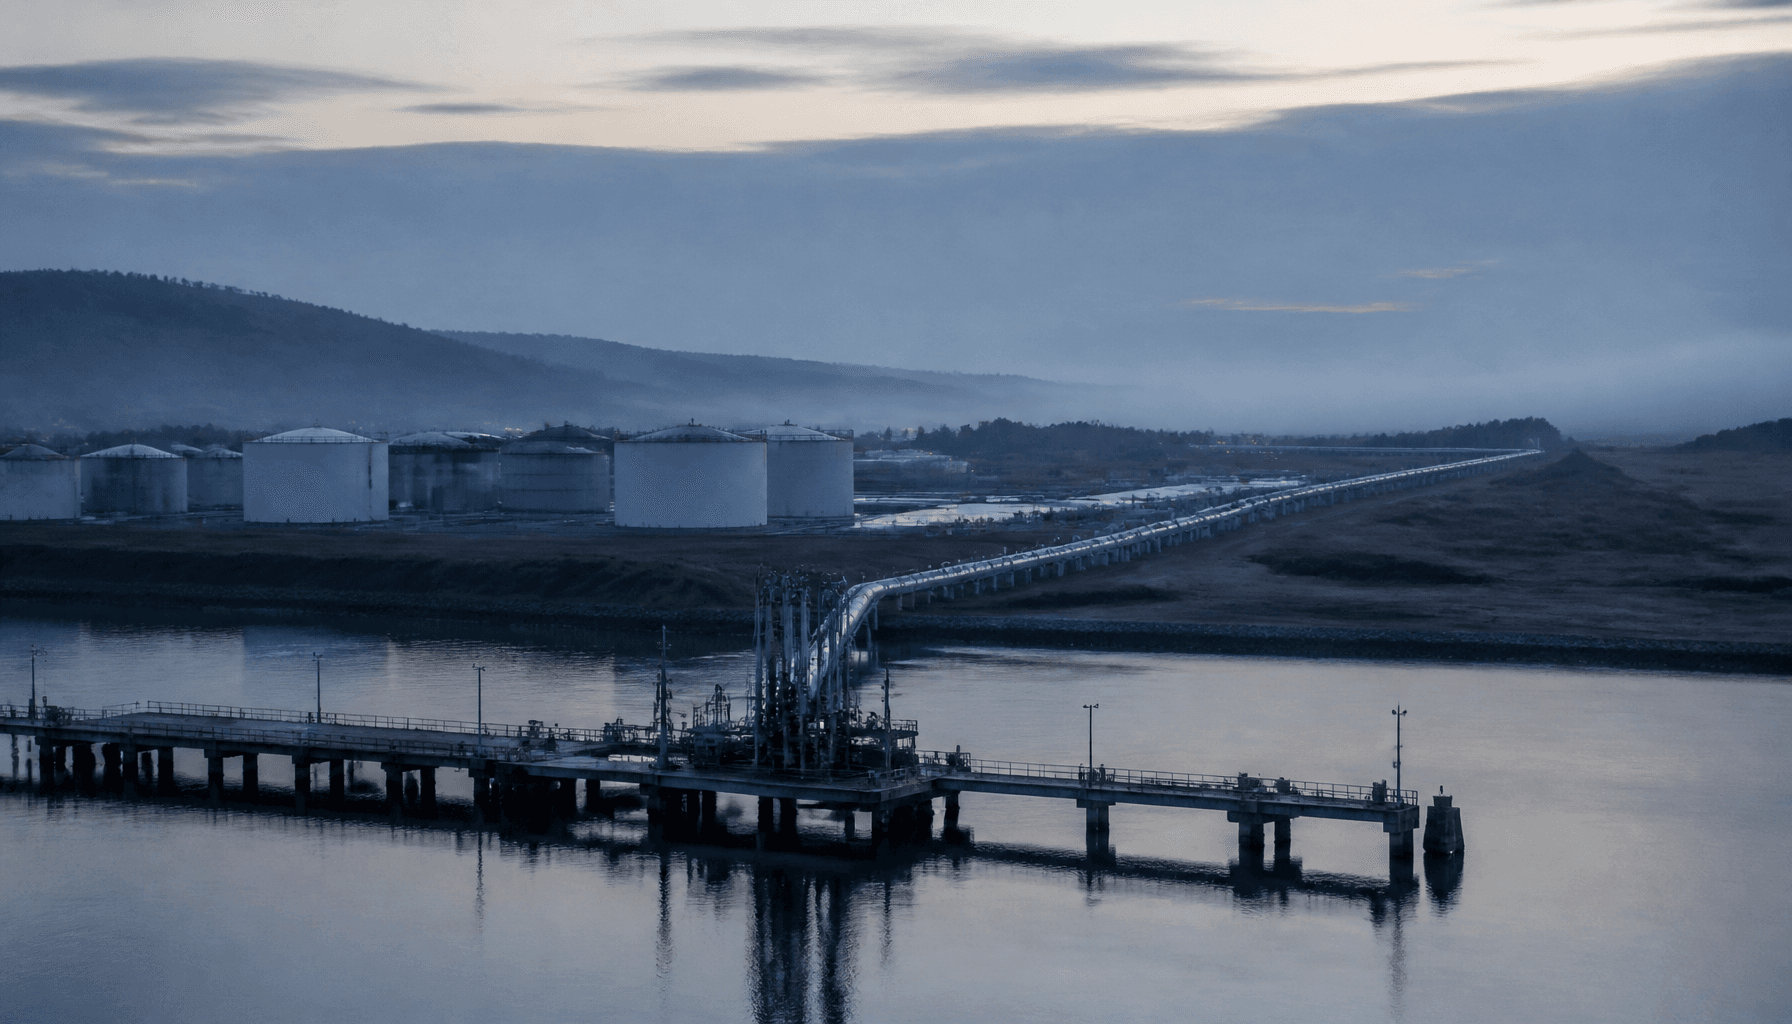
MBIE’s 6 September snapshot shows 51.7 days of petrol cover on paper. Only 34.5 of those days sit onshore. Eight of nine ships still float outside the EEZ, and sequential Hormuz then Red Sea stress is already priced into $3-plus petrol.
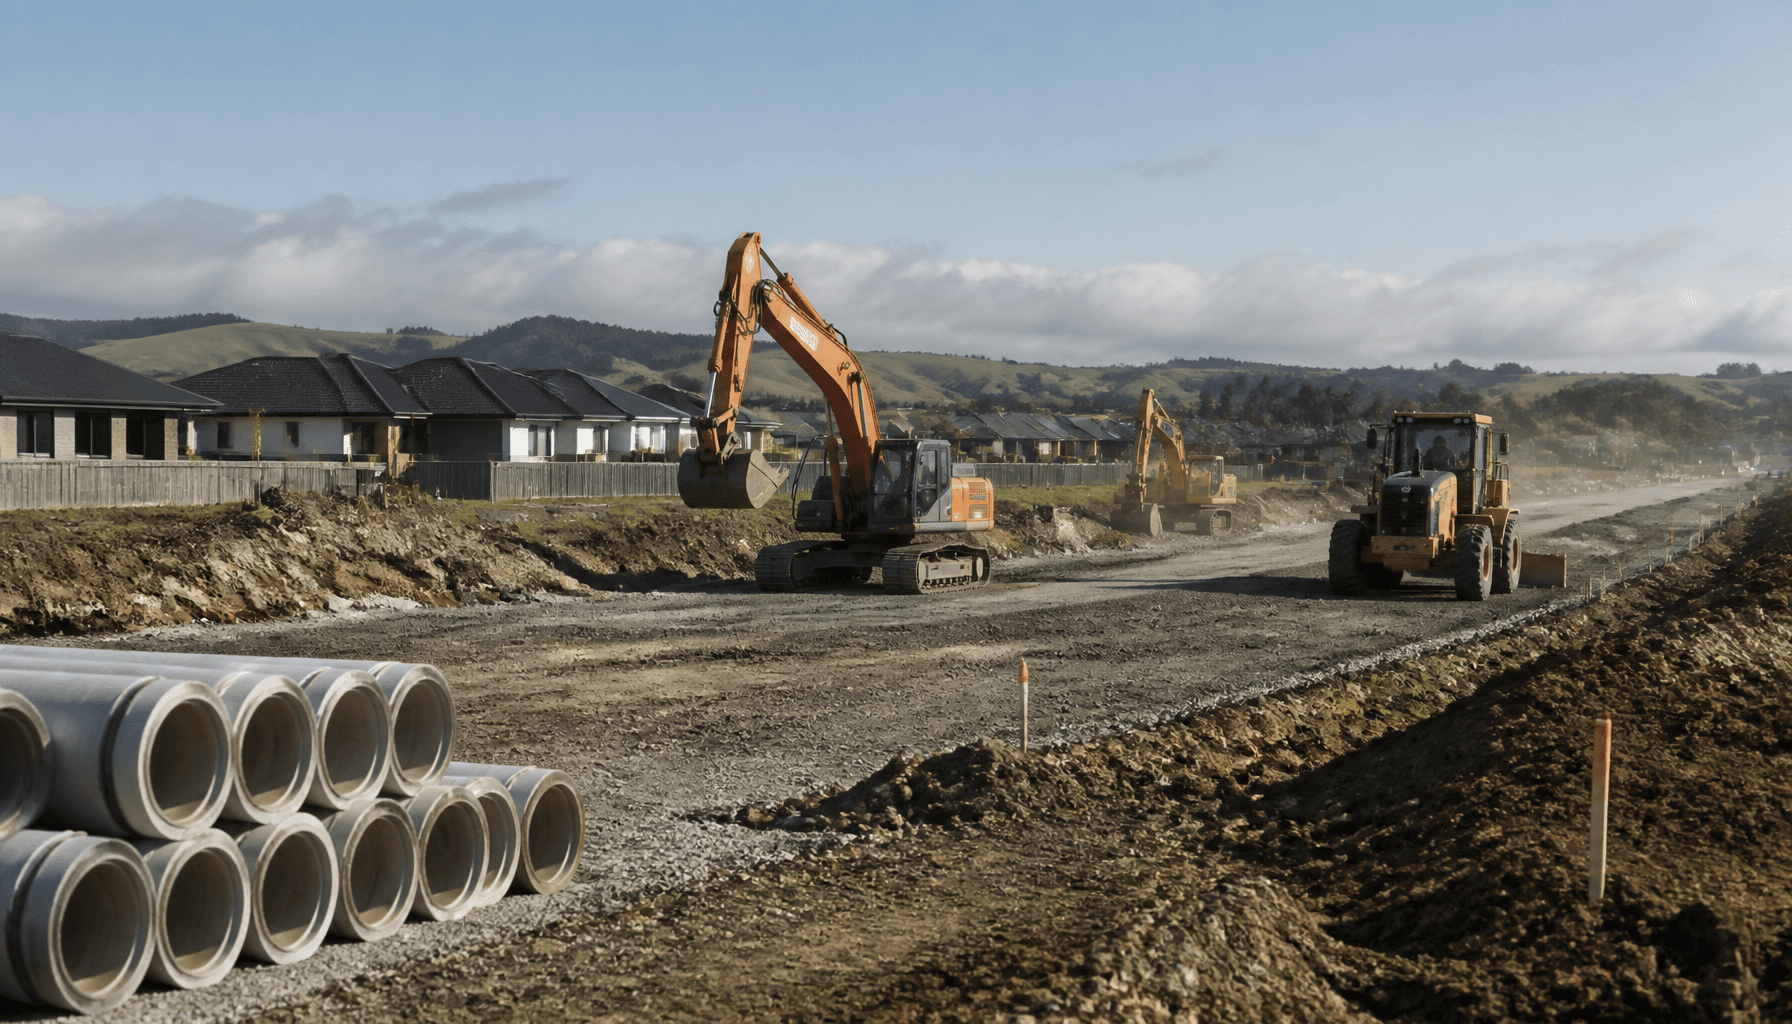
Labour productivity in New Zealand heavy and civil construction fell 6% between 2020 and 2024, according to Newsroom’s reporting of Te Waihanga, the New Zealand Infrastructure Commission, data. The decline wiped out virtually all of the sector’s gains over the previous twenty years. Primary Commission tables for the 2020–2024 print were not independently verified at filing.
That four-year drop sits on a thin long-run base. Te Waihanga’s September 2022 research found labour productivity rose only 5% in heavy and civil engineering construction between 2000 and 2020. Building construction rose 23% and construction services 25% over the same span. Economy-wide labour productivity grew about 30%.
Civil work accounts for about 80% of the cost of building and maintaining infrastructure networks — power, water, transport and telecommunications. Weak output per hour therefore hits almost every principal, from NZ Transport Agency Waka Kotahi and local road authorities to water entities, Transpower, Chorus, the Ministry of Education and Kāinga Ora.
Peter Nunns, then Te Waihanga’s Director of Economics, said in 2022 that faster productivity growth can cut costs and ease workforce pressure. He estimated that if civil construction had matched building-construction productivity growth over those two decades, infrastructure prices would have been about 10% lower, workforce needs about 11% lower, and New Zealand would have built about 5% more infrastructure.
Labour productivity growth by sector, 2000–2020
Civil construction lagged building, services and the wider economy over two decades.
Source: Te Waihanga, Economic performance of New Zealand’s construction industry (Sep 2022)
Faster productivity growth can help bring down costs, improve quality and reduce pressure on an already stretched workforce.
Nunns said low civil productivity growth was concerning because civil represents about 80% of network build-and-maintain cost. Stats NZ’s whole-industry construction series corroborates recent softness, though it is not identical to Te Waihanga’s civil-only measure.
In the year ended March 2025, construction labour productivity fell 3.4% as output dropped 8.5% and labour inputs fell 5.3%. Output contracted faster than hours. Construction labour productivity also fell 1.7% in the year ended March 2023 and 0.5% in the year ended March 2022.
Construction industry labour productivity, annual change
Output fell faster than hours in the year ended March 2025, pulling LP down 3.4%.
For the measured sector overall in the year ended March 2025, labour productivity rose 0.8%, multifactor productivity fell 0.9%, and capital productivity fell 3.0%, Stats NZ said. Construction’s drag stood out against that backdrop.
New Zealand already spends heavily relative to peers. Te Waihanga’s National Infrastructure Plan states the country invested around 5.8% of GDP a year on infrastructure over the past two decades — among the top OECD spenders — yet ranks toward the bottom for efficiency, or “bang for buck.” Consenting alone costs infrastructure projects about $1.3 billion each year.
Infrastructure pipeline and spending snapshot
Spend intensity
5.8% GDP/yr
Consenting cost
$1.3bn/yr
Pipeline (Bishop)
~$290bn
Funded slice
~$190bn
High spend intensity with bottom-tier efficiency raises the cost of every deferred project.
Source: Te Waihanga National Infrastructure Plan; Bishop, Civil Contractors NZ Conference, 13 Aug 2026
The National Infrastructure Pipeline catalogued 11,925 projects worth $275 billion in planning or delivery in the Plan’s executive summary. Infrastructure Minister Chris Bishop told the Civil Contractors NZ conference on 13 August 2026 that about $290 billion of projects sit in the pipeline, with around $190 billion carrying a confirmed funding source. Every lost percentage point of civil output per hour raises the real cost of that funded slice.
MBIE’s National Construction Pipeline Report forecasts total construction activity falling to $55.7 billion in 2025, from $58.1 billion in 2024 and $63 billion in 2023, before trending toward $65.4 billion by 2030 as residential recovers. Stop-start volumes discourage capital deepening and process investment that lift measured productivity.
Bishop also set out client-side unit-cost gains. Average classroom cost has fallen from about $1.2 million to around $620,000, he said, with more classrooms delivered in 2024 than in 2023 and more again in 2025. Kāinga Ora average build cost was about $3,400 per square metre in late 2023; in the year to June 2026 the average was around $2,700, with new contracts as low as about $2,600. By end-2026 the Coalition expects to have started construction on over $20 billion of central government infrastructure projects.
Those unit-cost prints can coexist with multi-year civil productivity weakness. Recent client control may concentrate in vertical building work, or may not yet show fully in industry productivity accounts. Building and Construction Minister Chris Penk cited an industry-association report in August 2024 claiming sector productivity levels had remained the same since 1985; that coarser claim sits alongside, rather than replaces, Te Waihanga’s sub-sector series.
Te Waihanga’s 2025 Delivering better value work argues traditional lowest-price, high risk-transfer procurement has hollowed client capability. International experience points to potential project-cost reductions of up to about 30% under more collaborative, sophisticated-client models. Construction wages have also risen faster than the value produced — a classic lagging-productivity symptom.
Cost benchmarking in Te Waihanga’s 2022 Lay of the land study found New Zealand input costs broadly in line with high-income peers. Premiums concentrate on complex large horizontal projects such as motorways, tunnels and underground rail, pointing to delivery, standards, consenting and institutional factors rather than wages or materials alone.
Australia offers little comfort. Oxford Economics estimates Australian construction productivity is worse than in 1990, with stagnant growth costing about A$62 billion a year in lost work. ABS data show construction multifactor productivity fell 2.8% and labour productivity 2.9% in 2024–25 as hours rose to complete large heavy and civil programmes.
Households feel weak civil productivity through higher rates and water charges, deferred renewals, congestion and slower horizontal infrastructure for housing. With fiscal headroom tight and a pipeline measured in the hundreds of billions, efficiency is the residual that determines how much physical infrastructure any given tax and rates dollar buys.
What moves the needle is pipeline stability across political cycles, collaborative client models, consenting and standards reform, and capital deepening that firms will fund only when volumes are predictable. Without measured gains in civil output per hour, high spending intensity will keep buying less lane-kilometre, less pipe and less resilience than New Zealand pays for.