New Zealand House Prices Stagnant in Real Terms for a Decade Under RBNZ Policy
New Zealand house prices have delivered zero real growth over the past decade. The Reserve Bank of New Zealand's decision to hold the official cash rate at 2.75 per cent continues to suppress demand while supply improvements and inflation matching nominal gains reshape the market.
"It is a period that people have focused on in the past, this whole idea that property values in New Zealand have always doubled every seven to 10 years."Kelvin Davidson, Cotality chief property economist
The Reserve Bank of New Zealand's Monetary Policy Committee voted 4-3 on 28 October 2026 to hold the Official Cash Rate at 2.75 per cent. Governor Anna Breman's alignment with external members for the hold places the full credibility burden on the 9 December Monetary Policy Statement.
The Reserve Bank of New Zealand's Monetary Policy Committee voted 4-3 on 28 October 2026 to hold the Official Cash Rate at 2.75 percent, defying market expectations of a further hike and leaving the tightening cycle conditional on incoming data.
The Reserve Bank of New Zealand's Monetary Policy Committee delivered a 4-3 surprise hold on the official cash rate at 2.75 per cent on 28 October 2026, defying near-universal expectations of a 25 basis point rise and triggering an immediate 1.3 per cent drop in the New Zealand dollar to 56.1 US cents.
New Zealand house prices have delivered zero real growth over the past decade. The Reserve Bank of New Zealand's decision to hold the official cash rate at 2.75 per cent continues to suppress demand while supply improvements and inflation matching nominal gains reshape the market.
Decade of Real Stagnation
New Zealand national house prices rose 34.7 per cent nominally over the decade to October 2026 according to Cotality data. Cumulative CPI inflation reached approximately 34 per cent over the same period. Real house prices therefore remained flat.
Cotality reported a 0.4 per cent decline in October 2026. This marked the seventh consecutive monthly fall. The national median stood at $790,987, down 2.3 per cent year on year. Values sit 19.1 per cent below the January 2022 peak.
The Reserve Bank held the OCR at 2.75 per cent on 28 October 2026 in a 4-3 split decision. September quarter CPI inflation printed at 3.7 per cent. The Bank expects it to rise to 4.4 per cent in December partly due to fuel prices.
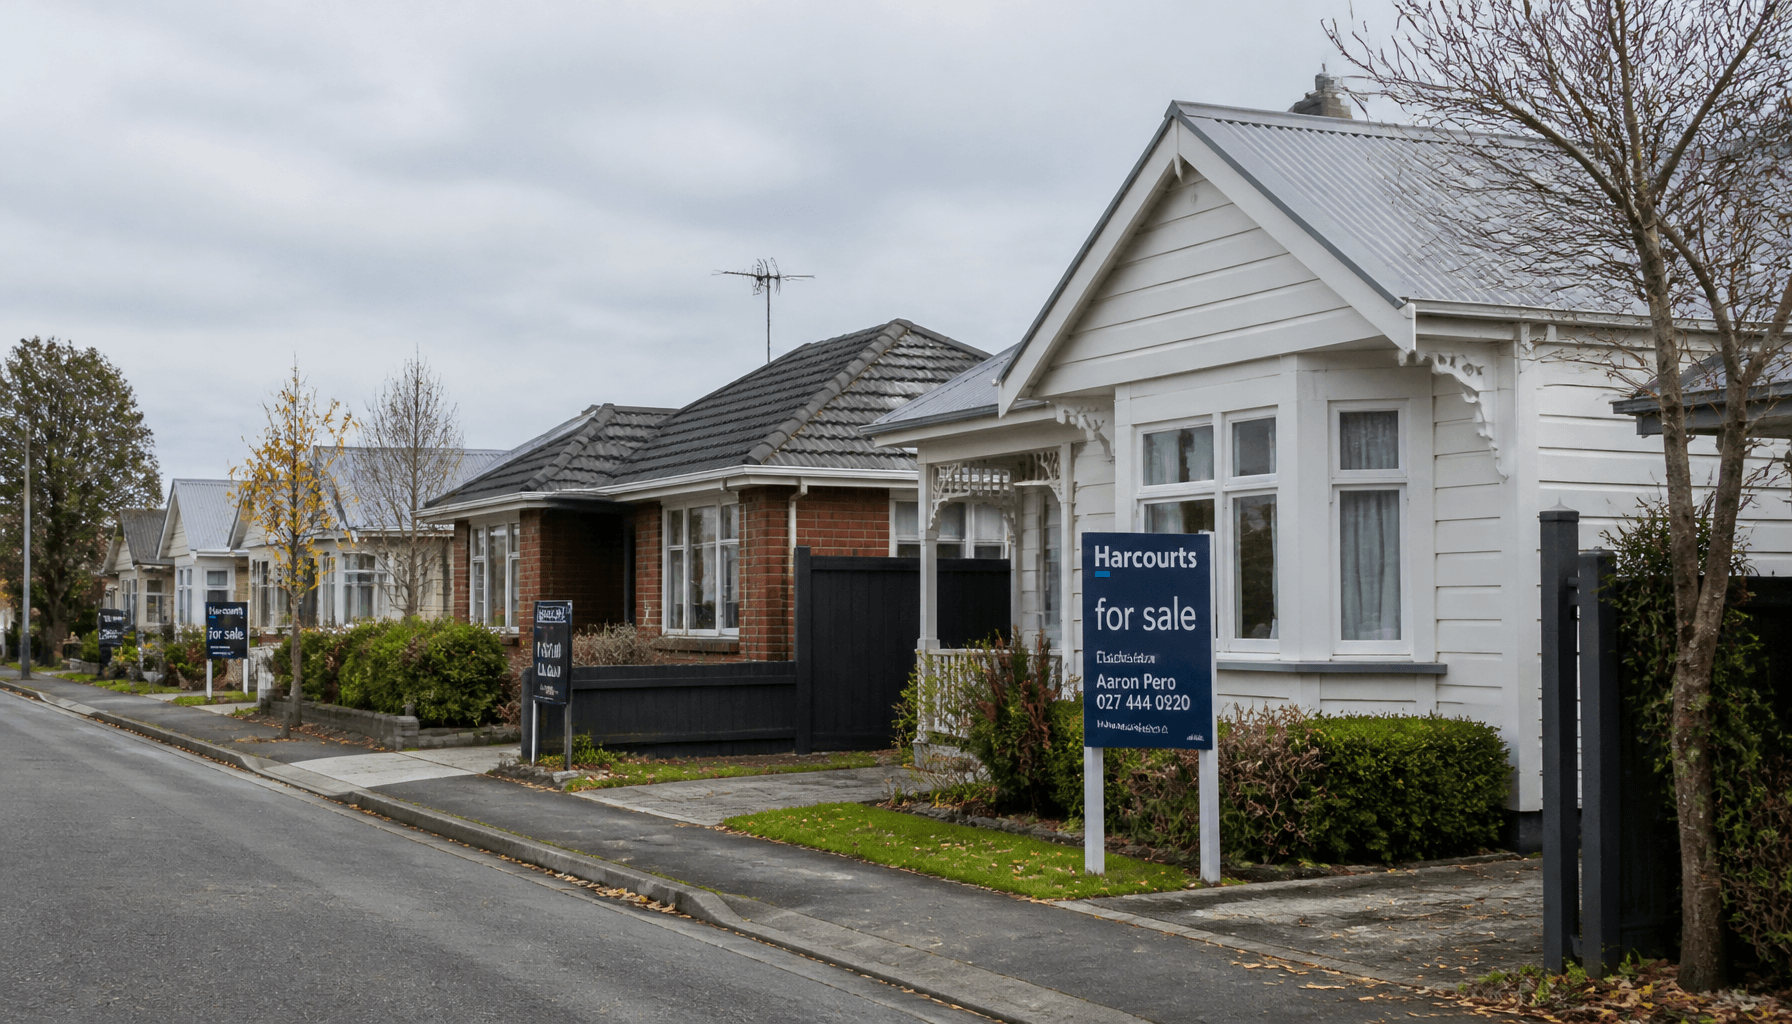
AI illustration of a New Zealand suburban street, used here to illustrate a decade of real house price stagnation amid RBNZ rate settings.
Why the Stagnation Matters Now
Residential property represents nearly half of household assets in New Zealand. The sector's total value reached $1.66 trillion across 1.74 million dwellings by mid-2026 according to Cotality. Prolonged flat real prices limit equity release for existing owners and constrain consumption.
First-home buyers reached a record 29.5 per cent share of purchases in the third quarter of 2026 per Cotality-Westpac data. Softer prices and lower deposit requirements in some segments supported entry. Overall transaction volumes however remained weak.
RBNZ M10 data showed the house price index at 3,365 in the June 2026 quarter, down from 3,404 in March. Quarterly sales volumes sat in the low 20,000s range, well below boom levels.
The Drivers
RBNZ monetary policy forms the primary demand-side driver. Elevated rates have weighed on borrowing capacity. Core inflation measures have edged toward the top of the 1-3 per cent target band. The Bank cited the need to return inflation sustainably to the 2 per cent midpoint.
Supply-side changes have also played a role. Auckland recorded only 1 per cent average annual growth over the decade. Cotality linked this to the unitary plan's supply effects. National figures were heavily influenced by Auckland weakness.
Historical growth rates provide context. Kelvin Davidson, Cotality chief property economist, noted that past decades delivered average nominal growth of 6 to 7 per cent per year. He suggested future averages might settle at 3 to 4 per cent.
"It is a period that people have focused on in the past, this whole idea that property values in New Zealand have always doubled every seven to 10 years."
Global Property Guide data showed New Zealand 10-year real house price growth at +16.32 per cent to Q1 2026. Australia recorded +29.05 per cent over the same period.
The Trade-offs
Tighter credit conditions have contained financial stability risks. Mortgagee sales totalled approximately 400 in the year to October 2026. This figure sits well below the post-GFC peak of more than 2,600 according to Cotality.
Buyers now hold stronger bargaining power. REINZ September 2026 data showed national median price at $755,000, down 2.3 per cent year on year. Sales fell 11.6 per cent. Elevated unsold stock persists.
Existing owners face limited equity gains. This dynamic may dampen residential investment and related employment. Construction activity could face pressure over the medium term.
AI illustration of first-home buyers at an open home, reflecting their record 29.5 per cent share of purchases in the third quarter of 2026.
Second-Order Effects
Fiscal implications arise from potential tax changes. Davidson noted the possibility of a capital gains tax under a future Labour government. ACT has proposed removing tax ring-fencing for property losses. Either change could alter investor behaviour.
Regional divergences may widen. Hamilton, Tauranga and Christchurch held steady in October. Some South Island markets posted gains. Auckland and Wellington continued to lag with October declines of 0.7 per cent and 0.9 per cent respectively.
First-home buyer resilience supports affordability in select segments. Prolonged weakness could however affect real estate sector revenues and local government rates bases tied to property values.
Historical Context
Earlier cycles often saw stronger nominal growth. The post-Covid boom delivered sharp gains before the correction. The current period has not been normal by historical standards, Davidson stated.
RBNZ data and Cotality reports align on recent monthly declines. Different indices produce varying median levels. Cotality, REINZ and Valocity figures reflect methodological differences.
The 7 November 2026 general election adds political uncertainty. Davidson cautioned that a cautious view on prices remains warranted regardless of outcome.
The Counter-Argument
Some analysts see resilience in provincial and South Island markets. First-home buyer activity remains robust even as aggregate volumes soften. Westpac forecasts a 1.4 per cent decline in 2026 followed by 1.8 per cent growth in 2027.
ANZ projects a 2 per cent fall in 2026 and a further 1 per cent decline in 2027. These forecasts suggest the downturn may prove mild and temporary.
Evidence for the thesis of a new normal rests on structural shifts. Improved housing supply responsiveness, completion of the dual-income household transition, and persistent inflation pressures support lower average growth going forward.
Open Questions
Sales activity could remain sluggish for 12 to 18 months amid higher mortgage rates and economic caution. The next RBNZ OCR decision and December CPI print will clarify inflation trajectory.
Mortgage lending data and consumer confidence surveys reinforce a buyer-favourable environment. House price expectations reached their lowest level since mid-2023 per ANZ-Roy Morgan.
Outlook
Market participants should monitor the election outcome and any subsequent policy signals on tax settings. A sustained period of 3 to 4 per cent nominal growth appears the most likely path. This outcome would mark a clear departure from prior speculative cycles while supporting gradual affordability gains for new entrants.